
The Roads and Traffic Agency (Agentschap Wegen en Verkeer) [2] and the Flemish Traffic Centre (Vlaams Verkeerscentrum) [3] provide open data about the current traffic situation [1]. More of 4000 measurement points dispersed all over Flanders – but mainly located on highways, detect each minute the number of vehicles and their speed.
We use the same front-end and data pipeline as presented for the pollution data [4]. Because the amount of data is pretty big (more than 4000 measurements each minute), only a small selection of measurement points (~ 100) is captured every 10 minutes by an edge node and send to flume for further processing [5]. Two streams are captured, one with the list of measurement points and the second with the real-time traffic data (see figure).
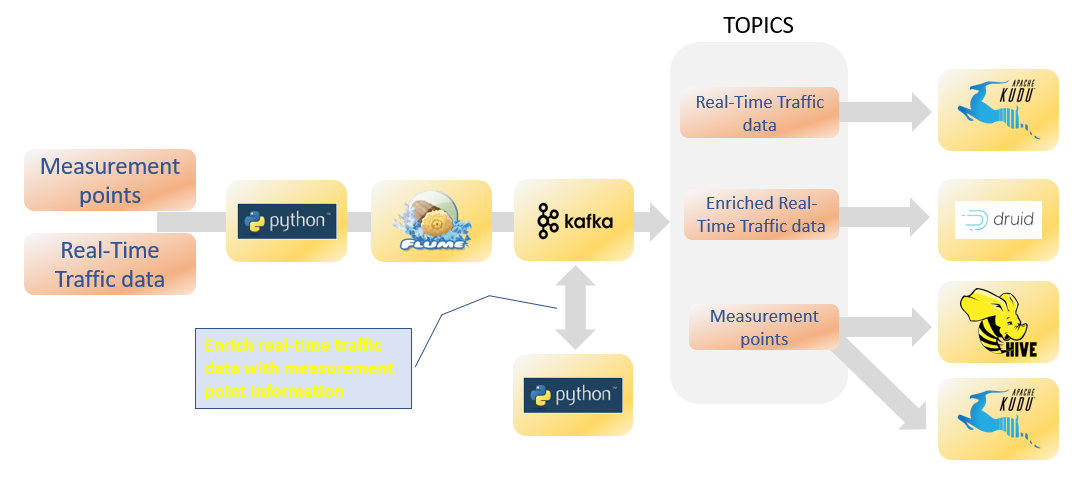
The traffic data are send to Apache Kafka [6] and two topics are created. The topic with measurement points are stored in Apache Hive [7] to have a structured query interface for further processing. The topic with the real-time traffic data is consumed with a python script and enriched with the measurement points stored in Hive to create a new Kafka topic with the enriched traffic data (see figure). This new topic is read by Druid [8] for visualization and data discovery using several tools such as Apache Superset [9].
The two other Kafka topics are send to Kudu tables which are used for the visualizations (see live map here).
[1] Meten-in-Vlaanderen (MIV) http://opendata.vlaanderen.be/dataset/minuutwaarden-verkeersmetingen-vlaanderen
[2] Agentschap Wegen en Verkeer http://www.wegenenverkeer.be/
[3] Vlaams Verkeerscentrum http://www.verkeerscentrum.be/
[4] Map of pollution in Flanders http://www.bigdatareflections.net/blog/?p=1
[5] Sending data to Flume using Python http://www.bigdatareflections.net/blog/?p=35
[6] Apache Kafka https://kafka.apache.org/
[7] Apache Hive https://hive.apache.org/
[8] Druid http://druid.io/
[9] Using Superset with Kudu http://www.bigdatareflections.net/blog/?p=52
