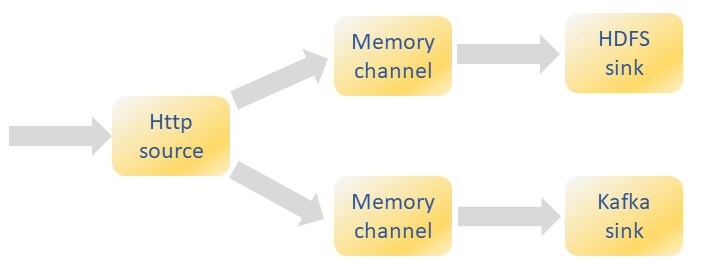
The Flume agents can be monitored individually by adding two parameters:
flume-ng agent -n agent_name -c conf -f conf config.conf -Dflume.monitoring.type=http -Dflume.monitoring.port=19256The parameters flume.monitoring.type=http and flume.monitoring.port=24105 enable JSON monitoring.
The metrics are retrieved with following URL: http://<ip-address-agent:24105/metrics
Example of a response:
{
    "SOURCE.http_traffic":{"OpenConnectionCount":"0","Type":"SOURCE","AppendBatchAcceptedCount":"2561700","AppendBatchReceivedCount":"2561700","EventAcceptedCount":"2561700","AppendReceivedCount":"0","StopTime":"0","StartTime":"1504012941615","EventReceivedCount":"2561700","AppendAcceptedCount":"0"},
    "SINK.k4":{"Type":"SINK","ConnectionClosedCount":"0","EventDrainSuccessCount":"2561700","KafkaEventSendTimer":"17461960","ConnectionFailedCount":"0","BatchCompleteCount":"0","EventDrainAttemptCount":"0","ConnectionCreatedCount":"0","BatchEmptyCount":"679409","StopTime":"0","RollbackCount":"0","StartTime":"1504012941570","BatchUnderflowCount":"3942"},
    "CHANNEL.c4":{"EventPutSuccessCount":"2561700","ChannelFillPercentage":"0.0","Type":"CHANNEL","StopTime":"0","EventPutAttemptCount":"2561700","ChannelSize":"0","StartTime":"1504012941382","EventTakeSuccessCount":"2561700","ChannelCapacity":"5000","EventTakeAttemptCount":"3245052"},
    "CHANNEL.c1":{"EventPutSuccessCount":"2561700","ChannelFillPercentage":"0.0","Type":"CHANNEL","StopTime":"0","EventPutAttemptCount":"2561700","ChannelSize":"0","StartTime":"1504012941382","EventTakeSuccessCount":"2561700","ChannelCapacity":"5000","EventTakeAttemptCount":"3242098"},
    "CHANNEL.c3":{"EventPutSuccessCount":"2561700","ChannelFillPercentage":"0.0","Type":"CHANNEL","StopTime":"0","EventPutAttemptCount":"2561700","ChannelSize":"0","StartTime":"1504012941381","EventTakeSuccessCount":"2561700","ChannelCapacity":"5000","EventTakeAttemptCount":"3245036"},
    "SINK.k3":{"BatchCompleteCount":"22260","ConnectionFailedCount":"15","EventDrainAttemptCount":"2561701","ConnectionCreatedCount":"2228","Type":"SINK","BatchEmptyCount":"679389","ConnectionClosedCount":"2223","EventDrainSuccessCount":"2561700","StopTime":"0","StartTime":"1504012941383","BatchUnderflowCount":"3942"}
}
The source metrics are listen in the next table.
| Table: Source metrics | |
| Metric | Description |
| EventReceivedCount | The total number of events that the source has received until now. |
| EventAcceptedCount | The total number of events where the event was successfully written out to the channel and the source returned success to the sink/RPC client/system that created the event. |
| AppendReceivedCount | The total number of events that came in with only one event per batch (the equivalent of an append call in RPC calls). |
| AppendAcceptedCount | The total number of events that came in individually that were written to the channel and returned successfully. |
| AppendBatchReceivedCount | The total number of batches of events received. |
| AppendBatchAcceptedCount | The total number of batches successfully committed to the channel. |
| StartTime | Milliseconds since the epoch when the source was started. |
| StopTime | Milliseconds since the epoch when the source was stopped. |
| OpenConnectionCount | The number of connections currently open with clients/sinks (only an Avro Source currently exposes this). Type For sources, this always returns SOURCE. |
The next table gives more information on the channel metrics.
| Table: Channel metrics | |
| Metric | Description |
| ChannelSize | The total number of events currently in the channel. |
| EventPutAttemptCount | The total number of events the source(s) attempted to write to the channel. |
| EventPutSuccessCount | The total number of events that were successfully written and committed to the channel. |
| EventTakeAttemptCount | The total number of times the sink(s) attempted to read events from the channel. This does not mean that events were returned each time, since sinks might poll and the channel might not have any data. |
| EventTakeSuccessCount | The total number of events that were successfully taken by the sink(s). |
| StartTime | Milliseconds since the epoch when the channel was started. |
| StopTime | Milliseconds since the epoch when the channel was stopped. |
| ChannelCapacity | The capacity of the channel. |
| ChannelFillPercentage | The percentage of the channel that is full. Type For channels, this always returns CHANNEL. |
The Sink metrics given are:
| Table: Sink metrics | |
| Metric | Description |
| ConnectionCreatedCount | The number of connections created with the next hop or storage system (like when a new file is created on HDFS). |
| ConnectionClosedCount | The number of connections closed with the next hop or storage system (like when a file on HDFS is closed). |
| ConnectionFailedCount | The number of connections that were closed due to an error with the next hop or storage system (like when a new file on HDFS is closed because of timeouts). |
| BatchEmptyCount | The number of batches that were empty—a high number indicates that the sources are writing data slower than the sinks are clearing it. |
| BatchUnderflowCount | The number of batches that were smaller than the maximum batch size this sink is configured to use—this also indicates sinks are faster than sources if it’s high. |
| BatchCompleteCount | The number of batches that were equal to the maximum batch size. |
| EventDrainAttemptCount | The total number of events the sink tried to write out to storage. |
| EventDrainSuccessCount | The total number of events that the sink successfully wrote out to storage. |
| StartTime | Milliseconds since the epoch when the sink was started. |
| StopTime | Milliseconds since the epoch when the sink was stopped. Type For sinks, this always returns SINK. |
Note that Flume monitoring is also available with Cloudera Manager or Hortonworks Ganglia.

